This is a continuation of the
Process Intensifier - Optimization with CFD: Part 1 paper.
The power is computed directly from integrating the moment,
or torque, of the surface tractions about the axis of revolution of
the shaft for the impeller surfaces. These are directly influenced
by the RPM of the shaft, and the fluid rheology properties. In
this particular case, the flow regime is highly turbulent, given
the impeller size, speed, and viscosity of the fluid (water).
Therefore, the Spalart-Allmaras turbulence Model (SAM) with
standard wall functions was used to appropriately account for the
wall traction effects of the radial flow impellers. The
Spalart-Allmaras Model does not require extremely fine boundary
layer mesh resolution. Y+ values on the order of 100 or more
are acceptable. The mesh around the axial impellers was much finer
and so SAM was not needed. The resultant power number is computed
using the standard relationships with power, density, impeller speed
and diameter. Power numbers of many types of impellers can
be found on the
Impeller Page.
Power Number of the Impellers in Standard Tank Geometries
|
|
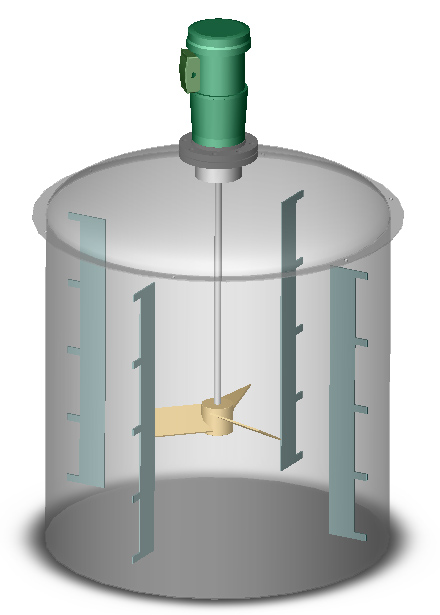
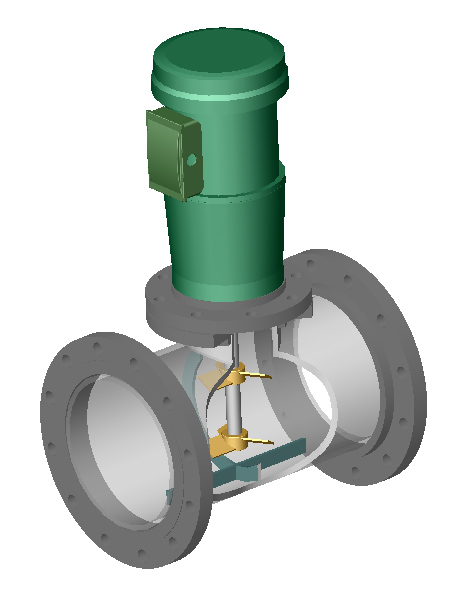
The other calibration test is Case A (Fig. 7). It is identical to
Case R except that the axial impeller used in HGA was used. It is a
3-bladed pitched bladed turbine
(PBT) with blades set
at 30 degrees and each blade had a width to diameter ratio of w/D =
0.25. The CFD predicted Np = 0.55. When placed closer to the bottom
(same distance as for Models HGA and LTA) the power number increased to
0.57. This reflects an increase of 4.4%, which is typical for the
proximity affect of axial flow impellers. A 45 degree, 4-bladed
PBT
(4PBT45) with w/D
has a Np = 1.27.
According to Nagata (Nagata 1967), the power changes as a function
of sin(angle)1.2. This means that a 4-bladed
PBT with 30
degrees (4PBT30)
would be Np = 0.63. Shaw measured Np = 0.58 (Shaw 1994). A 3-bladed
version would have less. Using Nagata's correlation for the determination
of Np, a 3-bladed PBT
with 30 degrees would be about 77.5% of a 4-bladed impeller, or
Np = 0.45-0.48. Increasing the w/D to 0.25, Nagata would predict an
increase of 21% or Np = 0.55 (derived from 4
PBT30) - 0.59
(derived from 4PBT
45). This is almost a perfect agreement with the CFD calculations.
The power numbers derived by the CFD are in extremely good agreement
with experimental data found in the literature. In both radial and
axial cases the agreement was within 1%. There should be great
confidence in the numbers predicted by the CFD for the same impellers but
in a different environment.
|
Case A
Fig 7: Case A
PBT
axial impeller)
|
| Power Numbers (Np) |
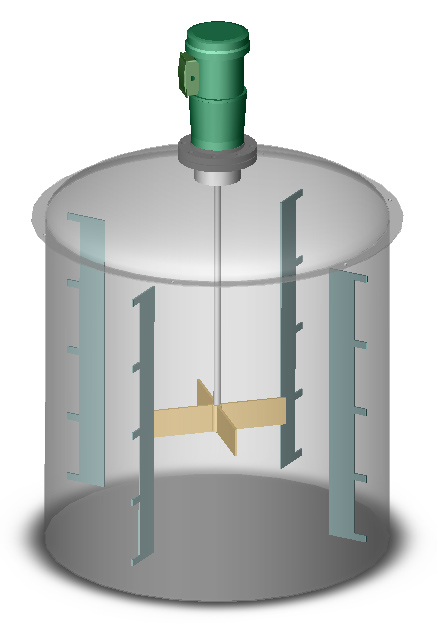
Model LTR |
Model HGR |
Model LTA |
Model HGA |
| Click on any picture for a bigger picture |
 |
 |
 |
 |
| |
Lightnin Radials |
Hayward Gordon Radials |
Lightnin Axials |
Hayward Gordon Axials |
| 0 GPM |
2.3, 2.2, 4.5 |
3.0, 2.9, 5.9 |
0.69, 0.78, 1.47 |
0.65, 0.62, 1.27 |
| 650 GPM |
2.0, 2.5, 4.5 |
2.4, 3.5, 5.9 |
0.76, 0.75, 1.51 |
0.65, 0.62, 1.27 |
| 1100 GPM |
2.0, 2.7, 4.7 |
3.0, 3.7, 6.7 |
0.83, 0.80, 1.63 |
0.61, 0.68, 1.29 |
| Table 1: Power Numbers (Np) for
each model. The impellers rotational speed is 1750 RPM. The Power
Numbers are listed in the following order: lower impeller, upper
impeller, total. |
The individual power numbers of Model LTR are lower than our verification in
a "standard" mixing tank. This means that the proximity factors for
this geometry are lower, about 0.59-0.79. The off-bottom of the lower impeller
is 0.5T and the off-bottom of the upper impeller (to the orifice plate) is also
0.5T. The coverage of the lower impeller to the orifice plate is also 0.5T,
whereas the upper impeller has a higher coverage, because of the T-pipe section.
The Oldshue proximity factor (PF) correlations are strictly reserved for
fully baffled, vertical cylindrical tanks. For comparison purposes, such a tank
with one impeller at 2.5" (63.5 mm) off-bottom and a coverage of 2.5"
(63.5 mm) (to the orifice plate) results in a PF = 0.56 and therefore Np = 1.90.
The value of 2.0 for the lower impeller is very close. Remember that in the Line
Blender, 650 to 1100 GPM (148 -250 m3/hr) flow is flowing against the impeller,
which is increasing the Np. For the upper impeller, the off-bottom is the same
(to the orifice plate), but the coverage is now to the top of the T, or
7.87" (200 mm) (COV/D=1.57). According to Oldshue, PF = 0.77 or Np = 2.62.
It is interesting and reassuring that the two Line Blender cases are within 4%
of this value.
Power numbers of the wide-bladed radials from Hayward Gordon are not readily
available. If we assume that the power of a radial impeller is proportional to
the height of the blades (Nagata 1967), the power numbers of the Hayward Gordon
(HG) impellers would have to be 0.3/0.2 = 1.5 times higher than the Lightnin
impellers. Therefore, the lower HG radial should have a power number of about
3.0, which they do. The uppers would be approximately Np = 3.9, which is again
very close to 1.5 times the Lightnin impellers.
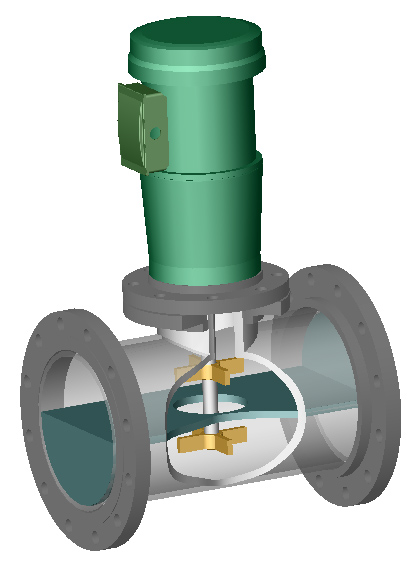
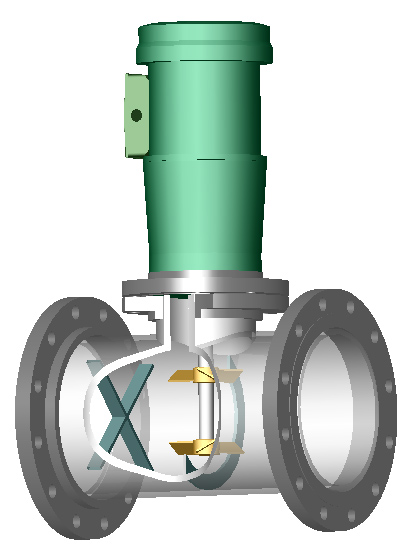
The axial impellers are 3-bladed, pitched bladed impellers at 30 degrees but
with a wider blade. The Hayward Gordon HGA had higher power numbers than our
standard Case A, even though it is the same impeller. What is interesting is
that the two impellers are opposing each other in flow direction. The upper
impeller is a down-pumper, while the lower impeller is an up-pumper. The outlet
flows of the impellers are impinging on each other. This is obviously driving up
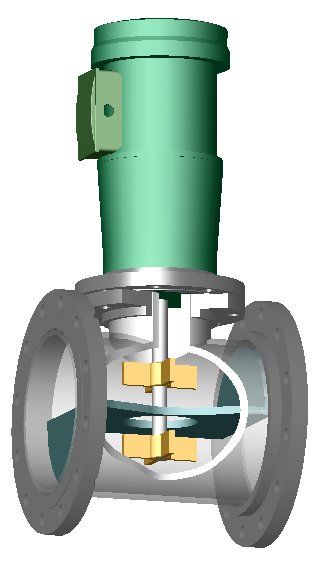
the power, with PF = 1.13 - 1.18. Furthermore, the spacing of the two impellers
is 4" (102 mm) (or S/D=0.8. If the impinging zone is considered to be
exactly in the middle between them, the distance to this plane is only S/D=0.4.
It is a well-known fact that as axial impellers get closer to an impinging
"wall", PF increases. It seems reasonable that the case of impinging
flows would increase Np beyond the PF of impinging on a stationary wall.
The only difference between the LTA and HGA impellers is the diameter and the
flow direction. It is interesting and unexpected that the power number of LTA is
about 16% more than the HGA at 0 GPM and 25% more than HGA at 1100 GPM (250
m3/hr). Both of the LTA impellers are smaller and both are down pumping. This
impeller configuration shows the greatest effect of flow rate on the power
number. Maybe this is because the impellers are smaller in diameter and the
cross flow has a greater impact on these impellers. Maybe the second horizontal
baffle on the bottom of the pipe has a significant effect on hindering a swirl
in the pipe, therefore driving up the power number. Since the horseshoe baffle
is continuous around the bottom of the pipe, the flow through the pipe may be
diverted into the outlet flow of the lower impeller causing the power to go up.
Without flow, the upper impeller is pumping more than the lower impeller, most
likely due to the larger entrance volume (T-section) above the impeller (see
Fig. 3).
In all of the above cases except LTA, the side flow does not seem to have a
great effect on the power number up to 650 GPM (250 m3/hr). Some of the models
did see minor changes at 1100 GPM (148 m3/hr). HGR saw the greatest impact, as
the impellers "appear" to be working harder.
Continue with Power Results
or Go back to Results
or Go back to the Title Page
|