This is a continuation of the
Process Intensifier - Optimization with CFD: Part 1 paper.
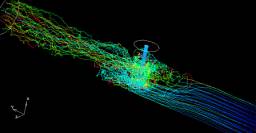
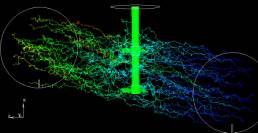
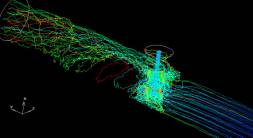
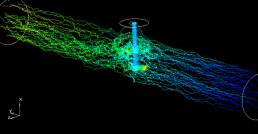
For many, it may be difficult to get an overall feeling of the flow pattern just by looking at these velocity plots. In order to visualize the flow pattern better, we took about 32 particles and spread them over the cross-sectional area of the pipe inlet. The computer tracks their progress through the pipe and Process Intensifier (Fig. 15). In all cases, the particles go from dark blue (0 s) to red (4 s) maximum. If a particle is in there longer than 4 seconds it is still red. The general flow is from right to left. The 0 GPM case was not studied for obvious reasons.
| 650 GPM
|
Radial Process Intensifier
|
Axial
Process Intensifier
|
| Lightnin |
 |
 |
|
LTR |
LTA |
| Hayward Gordon |
 |
 |
|
HGR |
HGA |
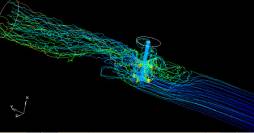
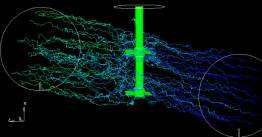
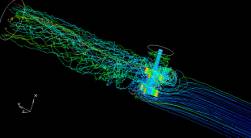
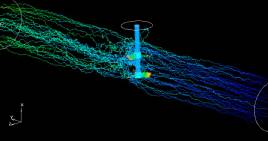
| Figure 15: Particle tracking to visualize the flow pattern. Dark blue = 0 s, light blue = 1 s, green = 2 s, orange = 3s, red ³ 4 s residence time. Based on the volume of the pipe and T-section and 650 GPM (148 m3/hr), the mean residence time of the tracers should be 2.2 s (green). Internals other than the impellers and shaft are not shown. |
The tracers appear to go by the LTA, barely being affected by the mixing. Most of the tracers make it through in less than 3 seconds. There appears to be 2 red tracks. A few particles make it into the T-section of the pipe. Although turbulent, a lot of particles almost seem to be following a streamline. Some light blue particles make it past the shaft. The effect of the impellers is not uniform.
There is a greater density of particles around the impeller in HGA indicating better mixing. Most of the tracers make it through in less than 3 seconds. There also appears to be 2 red tracks. The impellers appear to be drawing the particles into the center of the pipe. No light blue particles make it past the shaft. Short-circuiting is reduced as compared to LTA. Short-circuiting happens when the tracers are not caught in the flow generated by the impellers.
The Z-plate appears to trap some of the particles in LTR. They are getting into the recirculation zones and staying there. Even though the HGR has a smaller volume inside the Z-plate, some particles are still getting trapped. Many particles are also recirculating downstream of the active mixing zone for the HGR. There appears to be a large vortex running down the pipe from the outlet of the Process Intensifier and reattachment of the flow to the wall appears to happen just before the exit. This does not seem to be the case for LTR. There is no resemblance of any turbulent streamlines. There appears to be some short-circuiting of both models since light blue tracks are visible after the active mixing zone. Both the Radial devices have considerable recirculation in the T-section of the pipe.
| 1100 GPM
|
Radial Process Intensifier
|
Axial Process Intensifier
|
| Lightnin |
 |
 |
|
LTR |
LTA |
| Hayward Gordon |
 |
 |
|
HGR |
HGA |
| Figure
16: Particle tracking to visualize the flow pattern. Dark blue = 0
s, light blue = 1 s, green = 2 s, orange = 3s, red ³ 4 s residence
time. Based on the volume of the pipe and T-section and 1100 GPM, the
mean residence time of the tracers should be 1.3 s. Internals other than
the impellers and shaft are not shown. |
For the most part the comments for the 1100 GPM (250 m3/hr) case (Fig 16) are
the same as for the 650 GPM (148 m3/hr) case (Fig 15). The tracers seem
unaffected by the LTA, although there is a mixture of green and light-blue
tracers in the outlet.
There seems to be a significant amount of flow short-circuiting (light-blue
tracks) the HGA right between the impellers. This was stipulated when looking at
the velocity profiles.
Continue with Tracer Studies
or
Go back to Results
or
Go back to the Title Page
|
