This is a continuation of the
Process Intensifier - Optimization with CFD: Part 1 paper.
Unlike the flow pattern tracer study, this study shows the effect of mixing
in a second component (see Figures 17-18). The tracers are neutrally buoyant in
this study, but they could easily be made heavier or lighter than the bulk
fluid. The injection port of LTR and HGR is directly below the lower radial
impeller. 250 particles are injected at this point. The mean residence time of
the fluid based on volume and flow rate is 1.35 s (light-blue) at 650 GPM (148
m3/hr) and 0.80 s (blue) at 1100 GPM (250 m3/hr) for LTR and is 1.27 s
(light-blue) at 650 GPM (148 m3/hr) and 0.75 s (blue) at 1100 GPM (250 m3/hr)
for HGR. The difference is a function of the chamber volume.
The injection port for a Lightnin Line Blender with axial impellers is
between 5-10 pipe diameters upstream. We injected it in this study at 4 pipe
diameters upstream. Injection was studied at two locations: in the center of the
pipe (250 tracer particles) and also split by injecting at the respective
heights of the impellers (125 tracer particles each). The mean residence time of
the fluid based on volume and flow rate is 2.26 s (green) at 650 GPM (148 m3/hr)
and 1.34 s (blue-green) at 1100 GPM (250 m3/hr) .
HGA has a special injection pipe. It can be seen in Figures 5, 8, 9, and 10.
It is just upstream of the impellers, right after the flow straighteners.
Injection of the tracer was made at the respective impeller heights (125 tracer
particles each). The mean residence time of the fluid based on volume and flow
rate is 1.27 s (light-blue) at 650 GPM (148 m3/hr) and 0.75 s (blue) at 1100 GPM
(250 m3/hr).
| 650 GPM |
Radial Process Intensifier |
Axial Process Intensifier |
| Lightnin |
 |
 |
| |
LTR injection below lower impeller |
LTA single injection port |
| Lightnin |
|
 |
| |
|
LTA two injection ports |
| Hayward Gordon |
 |
 |
| |
HGR injection below lower impeller |
HGA two injection ports |
|
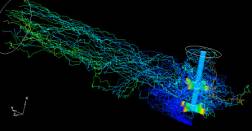
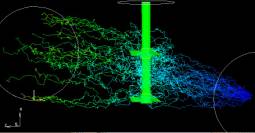
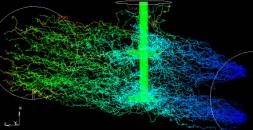
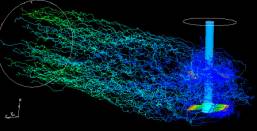
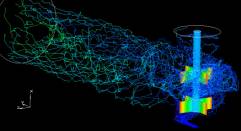
Figure 17: Particle tracking to visualize the flow pattern.
Dark blue = 0 s, light blue = 1 s, green = 2 s, orange = 3s,
red ³ 4 s residence time. Internals other than the impellers and
shaft are not shown. |
All of these plots (Fig. 17) appear to be doing a good job of mixing in the
second component.
It is noticeable that the tracers injected in the Radial Process Intensifiers
do not get sucked up straight into the lower impeller, but first swirls toward
the back Z-plate wall of the lower chamber. That distance is less for HGR. The
colors seem to indicate that LTR is getting a more uniform distribution of the
tracer particles. Some are even making it in and out of the T-section. There
seems to be a lot of recirculation downstream of the HGR based on the variety of
colors seen there.
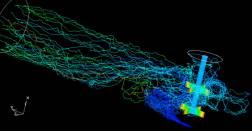
With a singular injection point, LT1 is able to spread the tracer particles
fairly uniform around the pipe cross section. None of the particles are making
it into the T-section and they all seem to have a very uniform residence time.
To improve on the mixing, 2 injection ports are studied at the respective
heights of the impellers. This appears to do a much better job of dispersing the
tracer particles. Some particles are getting into the T-section and they are
recirculating in there long enough to require more than 4 seconds residence
time.
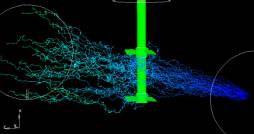
HGA also does a very good job of dispersing the tracer particles about the
cross-section of the pipe. It does appear that there is some recirculation going
on, though, based on the large number of blue traces among the green at the
outlet.
| 1100 GPM |
Radial Process Intensifier |
Axial Process Intensifier |
| Lightnin |
 |
 |
| |
LTR injection below lower impeller |
LTA single injection port |
| Lightnin |
|
 |
| |
|
LTA two injection ports |
| Hayward Gordon |
 |
 |
| |
HGR injection below lower impeller |
HGA two injection ports |
|
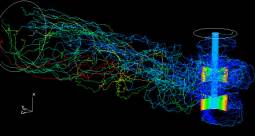
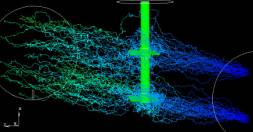
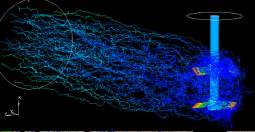
Figure 18: Particle tracking to visualize the flow pattern.
Dark blue = 0 s, light blue = 1 s, green = 2 s, orange = 3s,
red ³ 4 s residence time. Internals other than the impellers and
shaft are not shown. |
The most noticeable difference at 1100 GPM (250 m3/hr) (Fig 18) to the 650
GPM (148 m3/hr) case (Fig 17) is that the LTA appears to be having difficulty
staying in control of the flow pattern. With a single injection port, the tracer
particles appear to be just passing through the impeller zone. The lower
impeller pulls down some particles, and none of the particles are being pushed
up into the T-section. Two injection ports do improve the situation. The lower
impeller pulls down some particles, and some of the particles are being pushed
up into the T-section. There is a noticeable mixture of blue and green tracer
tracks in the outlet.
Continue with Impeller Flow
or
Go back to Results
or
Go back to the Title Page
|