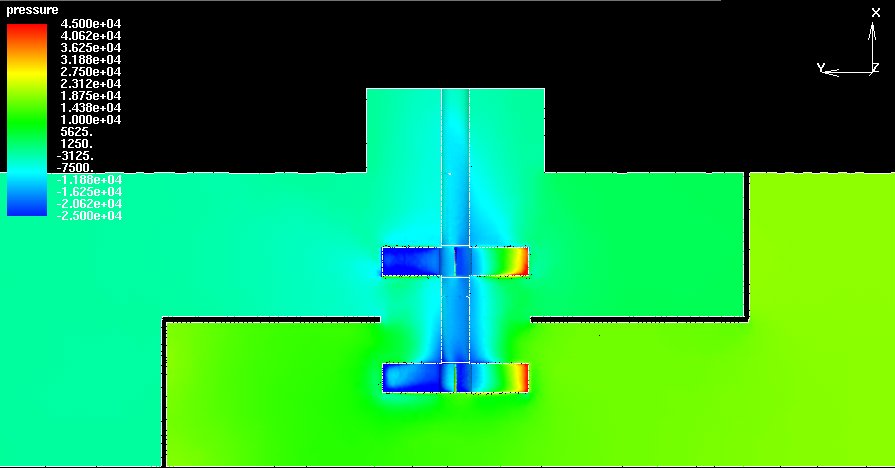
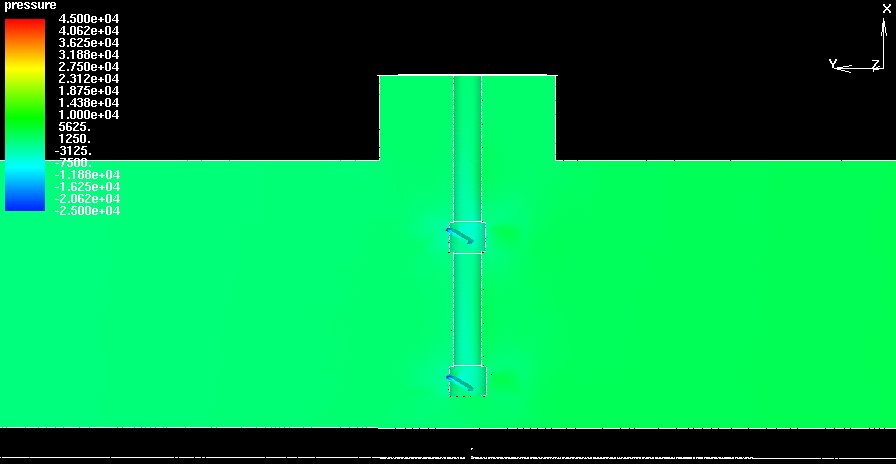
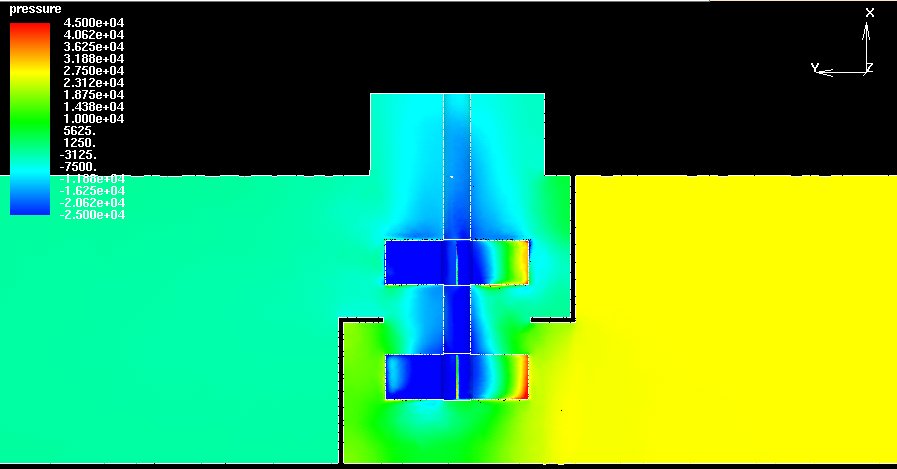
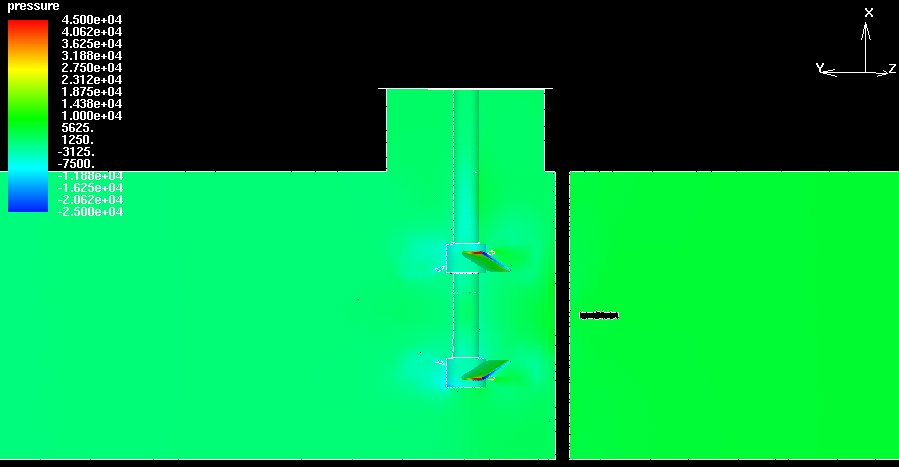
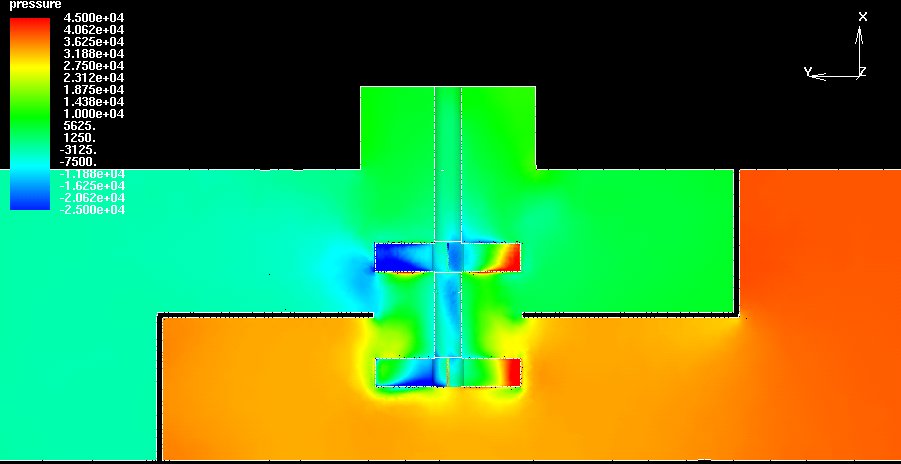
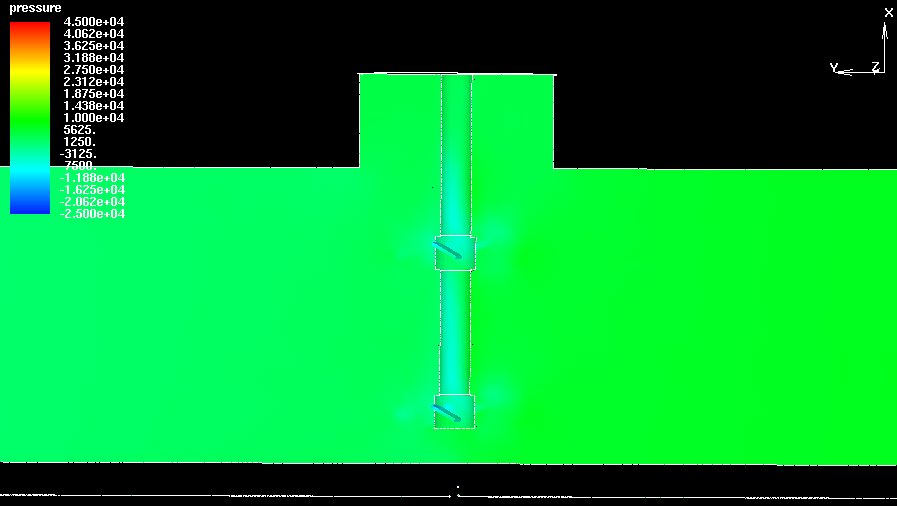
Unlike the pictures used to determine the pressure drop, these pictures are to show the pressure distribution and the relative comparison of pressure drop between the units. The scale is the same for each device. Red = 45,000 Pa (6.5 psig) is the highest pressure and blue = -2500 PA (-0.36 psig) is the lowest pressure (behind the blades: this was lost in Figure 8 because it was colored blue, just like the outlet). Bluish-green is in each case = 0, meaning that this shows pressure above the outlet pressure (gauge pressure). The numbers are in Pascals. The pressure drop is harder to determine using this representation, but it is very easy to see which units have the larges pressure drops.
650 GPM
Radial Process Intensifier
Axial
Process Intensifier
Lightnin
ΔP = 19305 Pa = 2.8 psig
ΔP = 1034 Pa = 0.15 psig
Hayward Gordon
ΔP = 26890 Pa = 3.9 psig
ΔP = 2758 Pa = 0.4 psig
Figure
9a: Pressure distribution in the Process Intensifiers at 650 GPM
(149 m3/hr). Click on any picture to get a larger view.
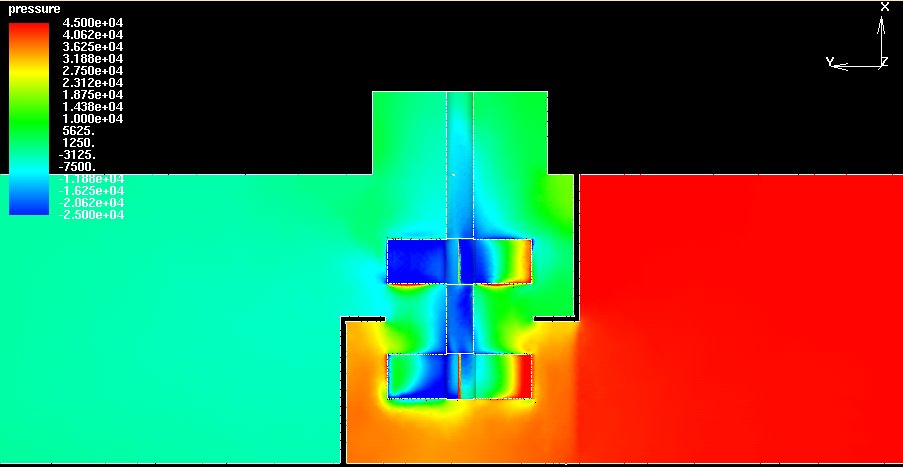
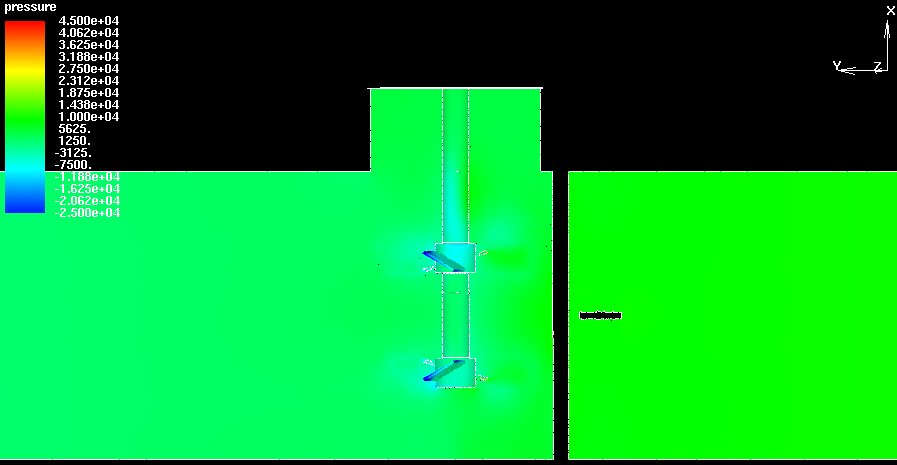
1100 GPM
Radial Process Intensifier
Axial
Process Intensifier
Lightnin
ΔP = 40,000 Pa = 5.8 psig
ΔP = 2,300 Pa = 0.3 psig
Hayward Gordon
ΔP = 45,000 Pa = 6.5 psig
ΔP = 5,500 Pa = 0.8 psig
Figure
9: Pressure distribution in the Process Intensifiers at 1100 GPM
(250 m3/hr). Click on any picture to get a larger view.